TODAY'S AGENDA: Day 3 - Functions & Relations
A diamond is merely a lump of coal that did well under pressure. Unknown

|
1) Review of Essential Skills and Inequalities
3) WARM UP: The video 4) LESSON: 1.1 Introduction to Functions 5) HANDOUTS: (i) Introduction to Functions Worksheet and (ii) Relations and Functions Example LEARNING GOAL I will distinguish functions from relations using a variety of methods: Set of ordered pairs {(0,2), (5,8)}; table of values xly; equation (y=2x+1); mapping diagram; and x-y graph. |
HANDOUTS
|
| ||||
WARM UP
LESSON: 1.1 Introduction to Functions
What is a Relation?
A relation is any relationship between the independent variable (x) and the dependent variable (y). In other words, a set of inputs and outputs, usually written as an ordered pair. (x,y)
A relation is any relationship between the independent variable (x) and the dependent variable (y). In other words, a set of inputs and outputs, usually written as an ordered pair. (x,y)
What is a Function?
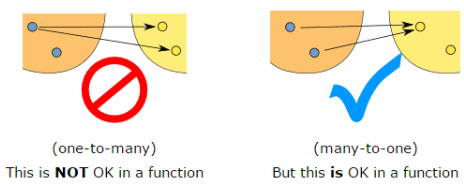
A function relates an input to an output. It is a special relation that has a single output for each input. That is, each "x" has only 1 "y" value.
"All functions are relations, but not all relations are functions."
RELATION NOT RELATION AND
A FUNCTION A FUNCTION
A function relates an input to an output. It is a special relation that has a single output for each input. That is, each "x" has only 1 "y" value.
"All functions are relations, but not all relations are functions."
RELATION NOT RELATION AND
A FUNCTION A FUNCTION
pasted from www.mathisfun.com
Functions can be represented in different ways:
- set of ordered pairs {(0,2), (5,8), (7,-10)}
- equation y = 2x + 5, y = x^2 + 2x -1, etc.
- input - output diagram input (x) -> x^2 + 5 -> output (y)
- function notation f(x) = 3x - 2
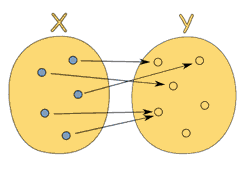
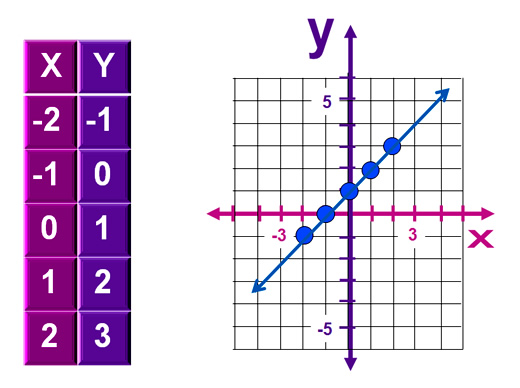
There are three major ways to show functions visually:
ARROW DIAGRAMS TABLES GRAPHS
- set of ordered pairs {(0,2), (5,8), (7,-10)}
- equation y = 2x + 5, y = x^2 + 2x -1, etc.
- input - output diagram input (x) -> x^2 + 5 -> output (y)
- function notation f(x) = 3x - 2
There are three major ways to show functions visually:
ARROW DIAGRAMS TABLES GRAPHS
|
|
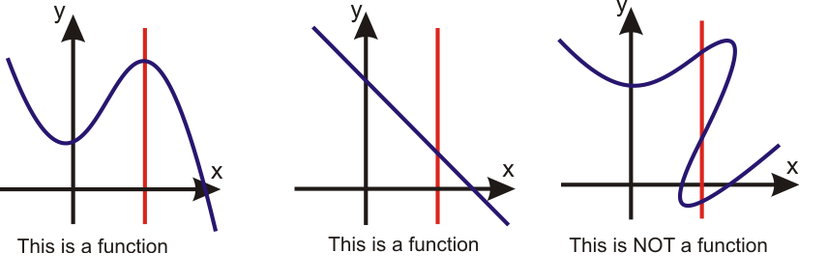
What is VLT?
It is vertical line test. It lets you determine if a graph is a function or not.
If any vertical line intersects (crosses) the graph of a relation more than once, the relation is not a function.
It is vertical line test. It lets you determine if a graph is a function or not.
If any vertical line intersects (crosses) the graph of a relation more than once, the relation is not a function.